Freight KPIs
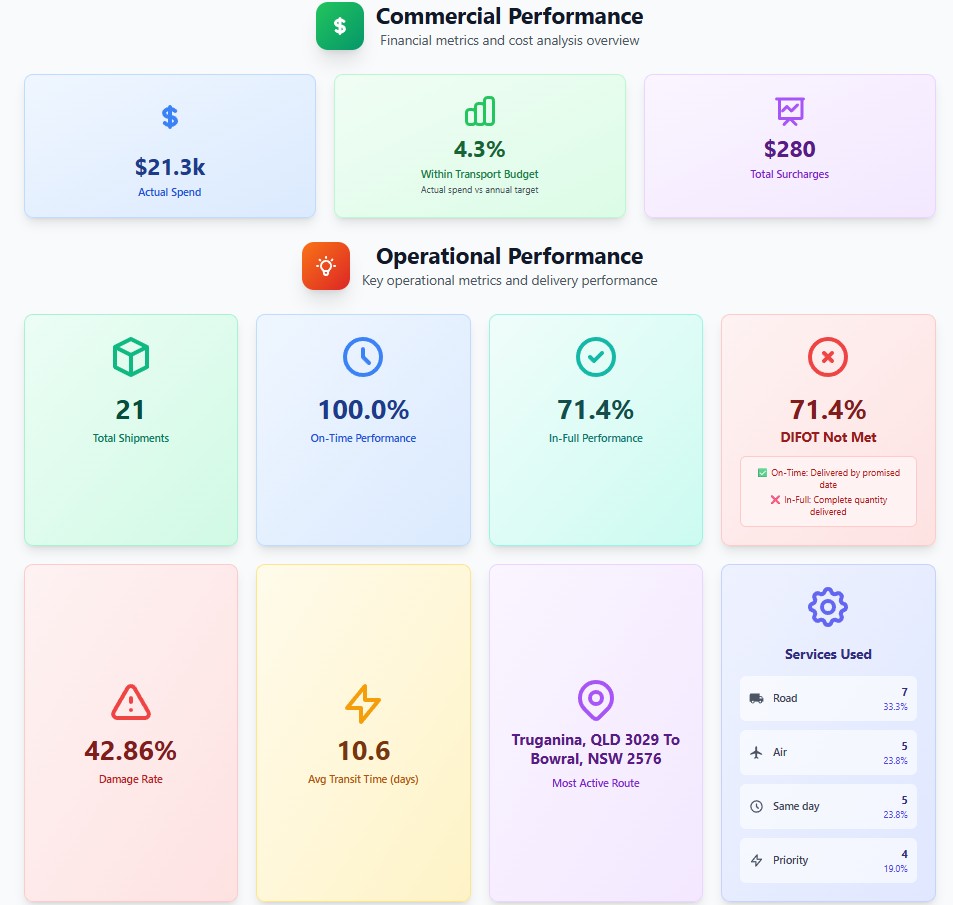
Monitor cost per shipment, on-time performance, exception rates, claims, CO₂e per lane and more.
Welcome to Primelytics - the intelligent freight analytics tool that transforms your historical shipping data into actionable insights, strategic cost savings, and powerful logistics planning. Upload your data, analyze patterns, and unlock the future of your freight operations.
Primelytics delivers immediate ROI and long-term strategic advantages for your logistics operations:
Import your freight CSV with shipment history, costs, carriers, and routing information from your TMS or accounting system.
Our advanced algorithms analyze patterns, calculate forecasts, identify opportunities, and generate comprehensive insights.
Receive instant recommendations, detailed forecasts, loyalty optimization, and downloadable executive reports.
Get started with Primelytics using basic shipment data. The more complete your data, the more accurate and valuable your insights become:
💡 Recommendation: For optimal results, provide 6-12 months of historical data. Even basic shipment information delivers powerful insights and immediate value.
Ready to unlock the full potential of your freight data? Primelytics provides the intelligence you need to make strategic decisions, optimize costs, and stay ahead of the competition.
Get actionable results in minutes, not months of manual analysis.
Stay ahead with predictive analytics and data-driven decision making.
Experience the power of intelligent freight forecasting. Upload your data today and discover your logistics potential.
Get in touch →PrimeLytics transforms your historical shipping data into clear dashboards and reports. Understand where you spend, which carriers perform, and how to cut costs without hurting service. Track KPIs across lanes, services and sites, then share insights with finance and operations.
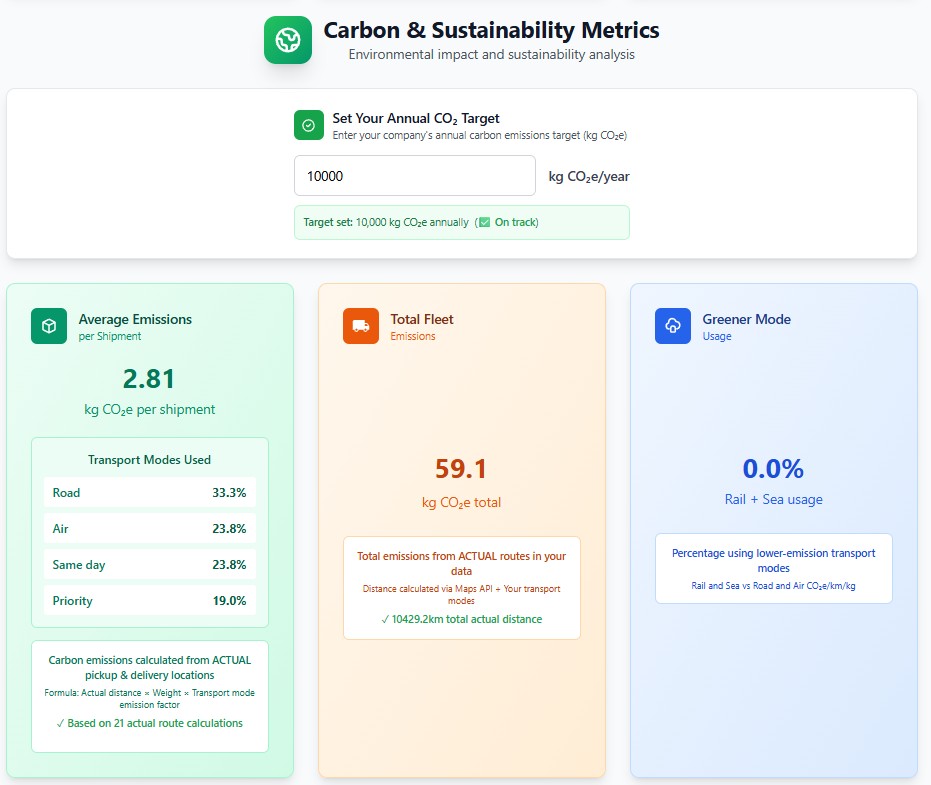
Monitor cost per shipment, on-time performance, exception rates, claims, CO₂e per lane and more.
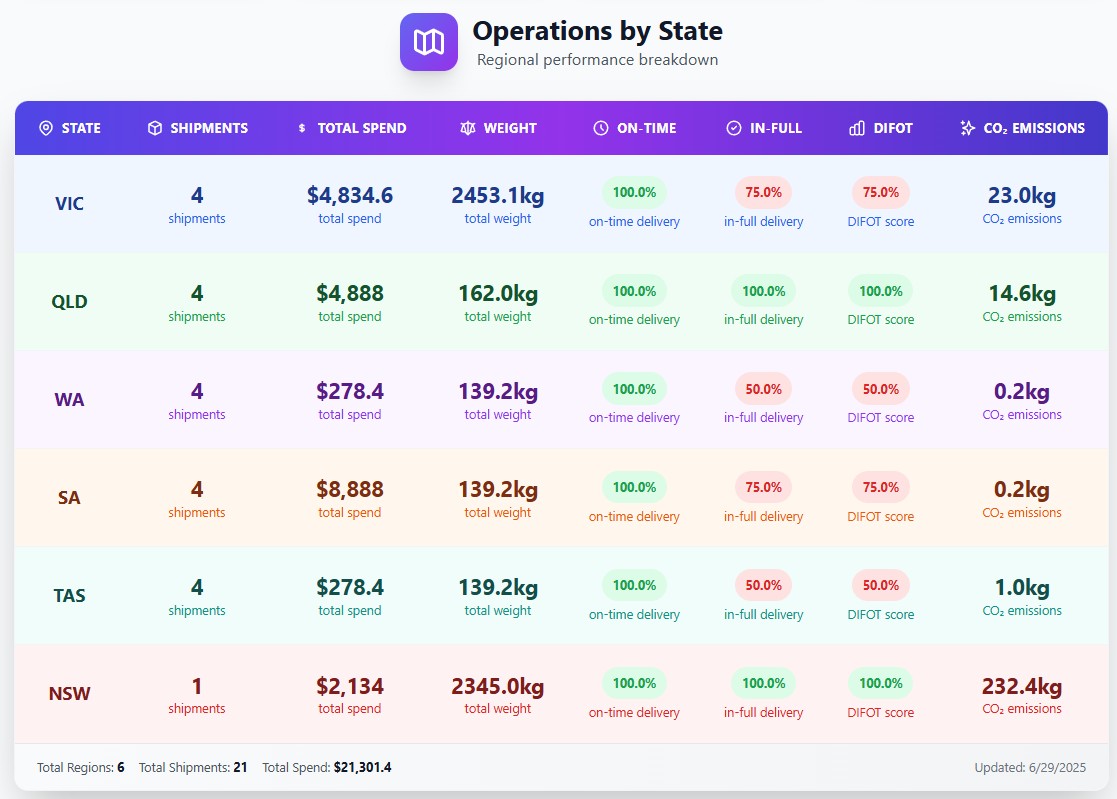
Slice by carrier, service, lane, site, mode and product. Save and schedule recurring exports.
Identify expensive lanes, service issues and savings opportunities; build business cases backed by data.
Manage operations in CargoVue, reconcile invoices with AuditVue, and report CO₂e in CarbonVue.
Common KPIs include cost per shipment, on-time delivery, damage/return rates, exceptions by reason, carrier spend share, CO₂e per lane and more.
Yes. Slice by carrier, service, site, lane, mode, product and customer segments. Save views for recurring reporting.
Yes. You can analyse operational data from CargoVue and finance data from AuditVue to close the loop on cost and service.